
We’ve changed the Midway programming approach for ONA17 to give attendees more insider information and best practices. This year will feature 10 panel discussions highlighting Midway participants’ areas of expertise, unique data, research and industry analysis — no pitches, no fluff.
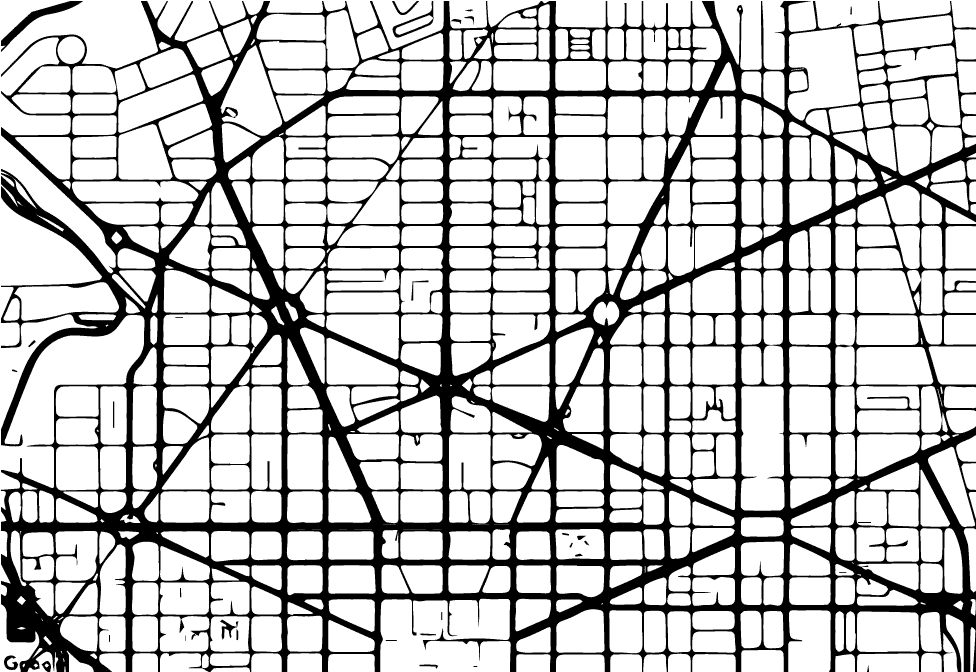
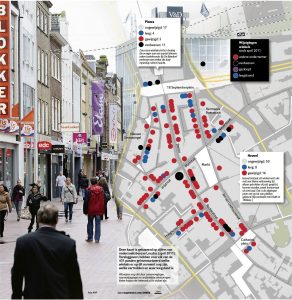
Maps and more: Engage your audience through data visualization
Friday, Oct. 6, 2-3 p.m.
Everyone loves data visualization, but it doesn’t simply make information easier to understand. Creating images collaboratively is one way to help data rise to the surface and provide new insights. This session takes a look at the ways mapping has evolved and allows journalists to tell stories in new ways, while also exploring emerging methods of data visualization and ways to share images.
Speakers:
- Matt Johnson, Alley Interactive, a digital studio that specializes in software development, data visualization, audience research, user experience, visual design and strategy services.
- Tony Sullivan, Wemap, which allows users to connect any data source to a map.
- Christian Erades, Maps4News, an online tool for creating tailored maps for visual storytelling.
Be sure to stop by each of these panelists’ booths for demos in the Midway, and also plan to attend this session for a discussion about all things data viz.